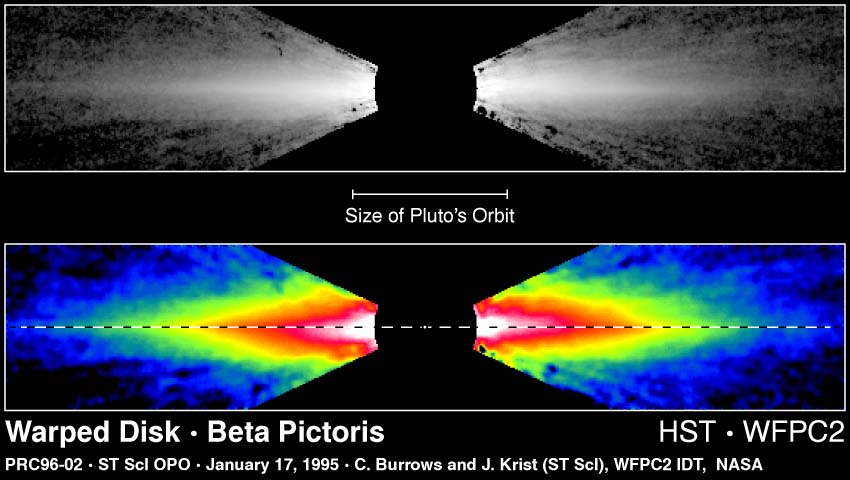
Here is one HST image of a
beautiful edge-on dust disk surrounding Beta Pictoris
(WFPC2 image obtained by Chris Burrows's group):
There are also newer images showing the disk even better:
the STIS image by Sally Heap's group
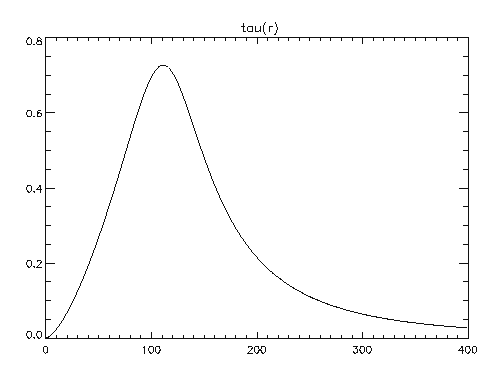
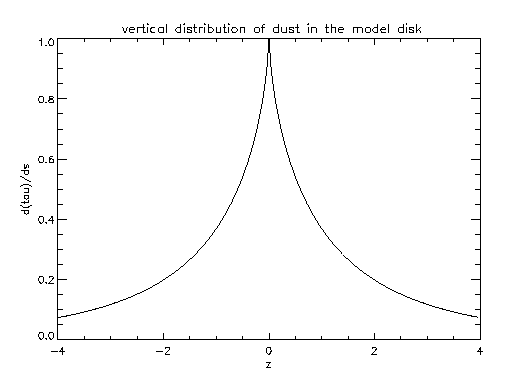
![]() The vertical dust density profile.
We use the following formula for d(τ)/ds, optical thickness per
unit length:
The vertical dust density profile.
We use the following formula for d(τ)/ds, optical thickness per
unit length:
d(τ)/ds = const. τ(r)/w exp(-(|z-zc|/w)p)
where w = width of the profile in vertical (z) direction,
zc = the coordinate of the maximum dust density, p=power law
determining the shape of the vertical profile, and the front constant
chosen so that the vertical disk opacity is indeed τ(r).
We used p = 0.7, which corresponds to a central sharp core of density
distribution (super-exponential). This is also a departure from previous
models, the ancient ones (A+B+P 1989 had p=2, Kalas & Jewitt 1995 had p=1).
Beta Pic disk has a dense and thin midplane region (w=1 in the
linear plot below):
![]() The disk width changes with radius in the
following way:
The disk width changes with radius in the
following way:
w(x) = 0.055 rm x3/4
which means that the disk is thicker outside than inside but not flaring, and
has thickness/radius ratio ~0.06 at 120 AU, which is very similar to that of the
solar nebula scale height (at Jupiter distance). Rather thin.
![]() The disk is inclined by a small angle (we used
here i=1.3o) to the plane including the line of sight. (The
line of nodes nearly perpendicular to the l.o.s.) The inclination gives the
values of zc throughout the model disk.
The disk is inclined by a small angle (we used
here i=1.3o) to the plane including the line of sight. (The
line of nodes nearly perpendicular to the l.o.s.) The inclination gives the
values of zc throughout the model disk.
![]() Scattering phase function of the dust.
We use an analytical approximation to empirical f(θ)
for cometary dust compiled from measurements of solar
system comets. The formula:
Scattering phase function of the dust.
We use an analytical approximation to empirical f(θ)
for cometary dust compiled from measurements of solar
system comets. The formula:
f(θ)=0.3 (0.2 + 0.5 θ) -3 + 1.4
(θ/3.3) 4 + 0.2 .
Importantly, alternative phase functions, most notably the Zodiacal Light
empirical phase function and some theoretical Mie scatterring functions will
be INAPPROPRIATE due to too large a peak in the forward scattering direction.
[ZL function from Lamy Perrin 1991 Orig&EvoInterplDust, 163) makes isophotes
climb higher instead of going more horizontally near the vertical axis.
Other ZL function are less peaked. The cometary function seems to have some
of that problem too.
Of course, we know that comet-like planetesimals are good candidates for
parent bodies of the dust in Beta Pic, so this is a nice, consistent result.
(Notice that Halley comet dust gives the best fit to the 10 micron silicate emission
feature of the Beta Pic disk).
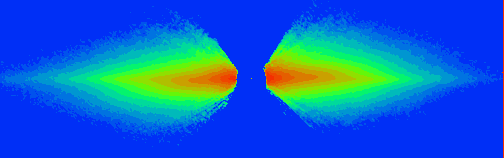
are reasonably well reproduced by our simple model
throughout the image (coloring worked so-so, suggesting larger
differences in normalization than they really are):
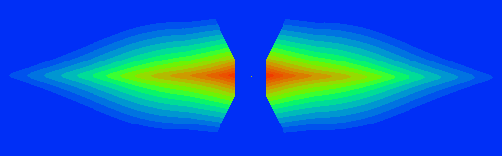
This isophotal shape agreement
is much harder to get than just the agreement of the "midplane
brightness" profiles along the spine of the disk:
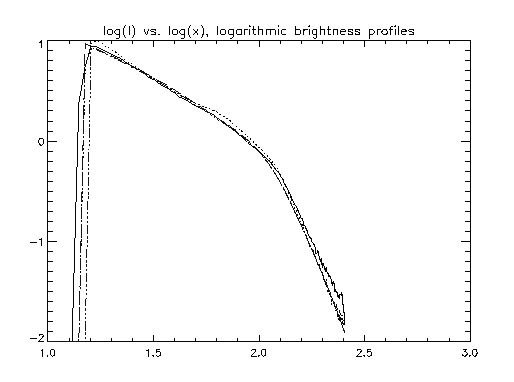
The solid line is the NE extension of the disk (l.h.s. on images)
and the dotted line is the SW side, and the dash-dotted lines are the
theoretical model.
Notice the power-law break at 100 AU mentioned already by A+B+P (1989) but first solidly proven by Golimowski, Durance & Clampin (1993) based on adaptive-optics ground-based coronography.